This project implements data visualization tasks using TypeScript, Vite, Apache ECharts, and Mantine v7. The goal is to process agricultural data, handle missing values, and render a table and a bar chart based on the dataset.
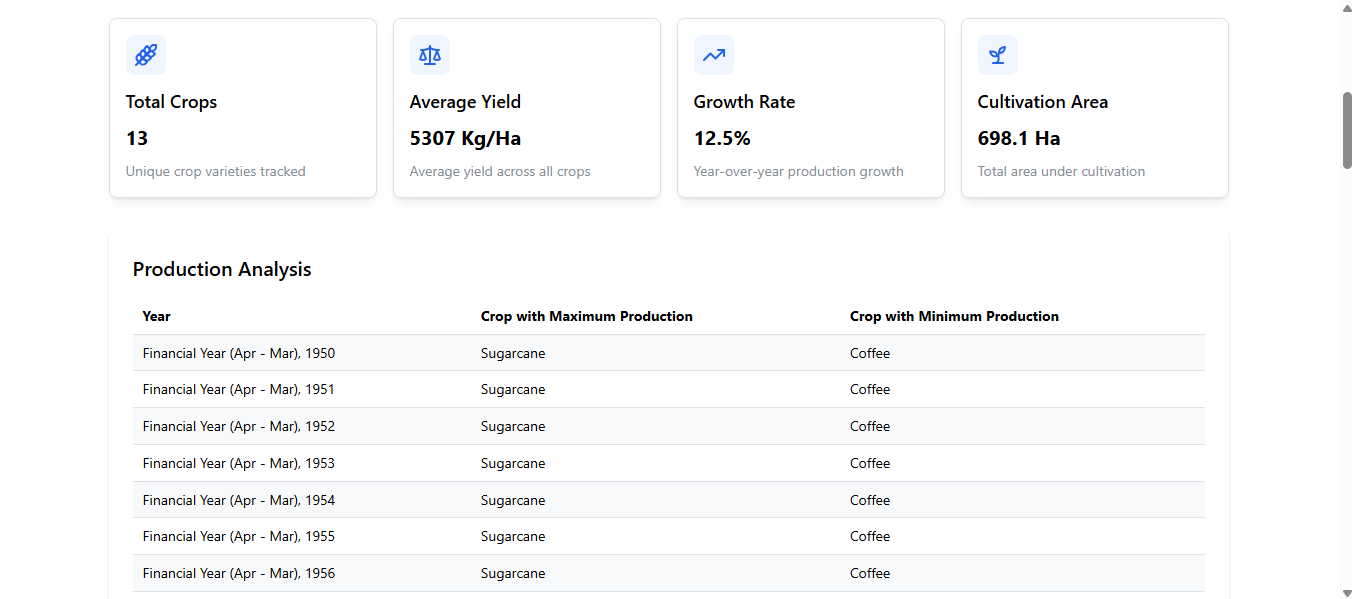
This table shows the crop with the maximum and minimum production for each year.
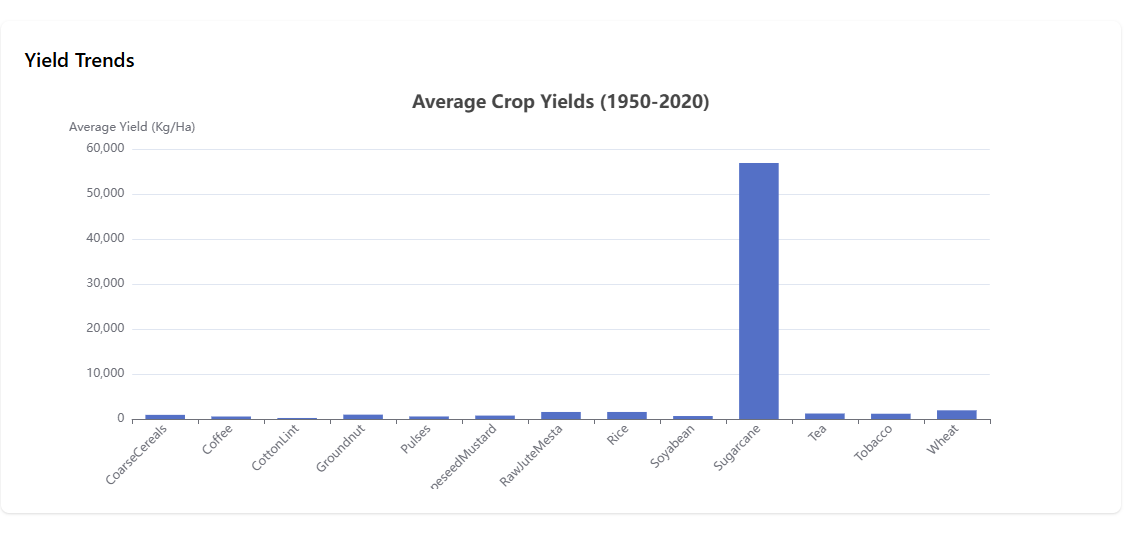
This bar chart displays the average yield of crops across all years (1950-2020).
- TypeScript: For strictly typed JavaScript.
- Vite: Development environment with fast build times.
- Apache ECharts: For creating the bar chart visualizations.
- Mantine v7: For creating the table component.
- Missing Values Handling: All missing or empty values in the dataset are replaced with
0before calculations or rendering. - Table Component:
- Displays the crop with maximum and minimum production for each year.
- Bar Chart Component:
- Displays the average yield of crops (1950–2020) using a bar chart.
Follow the steps below to set up and run the project:
git clone https://github.com/Suresh-Chelani/Crop-Data-Visualization.git
cd Crop-Data-Visualizationyarn install
yarn dev
- The application will automatically open in your default browser.
- You will see:
- A table showing the crop with the maximum and minimum production for each year.
- A bar chart showing the average yield of crops across all years.
- yarn dev: Starts the development server and opens the browser.
- yarn build: Builds the project for production.
- yarn preview: Previews the production build.
- Vite: ^4.0.0
- Apache ECharts: ^5.4.0
- Mantine v7: ^7.0.0
- TypeScript: ^4.0.0
This project is licensed under the MIT License.
- Dataset provided for the project assignment.
- Frameworks and tools used: Vite, Mantine v7, Apache ECharts.